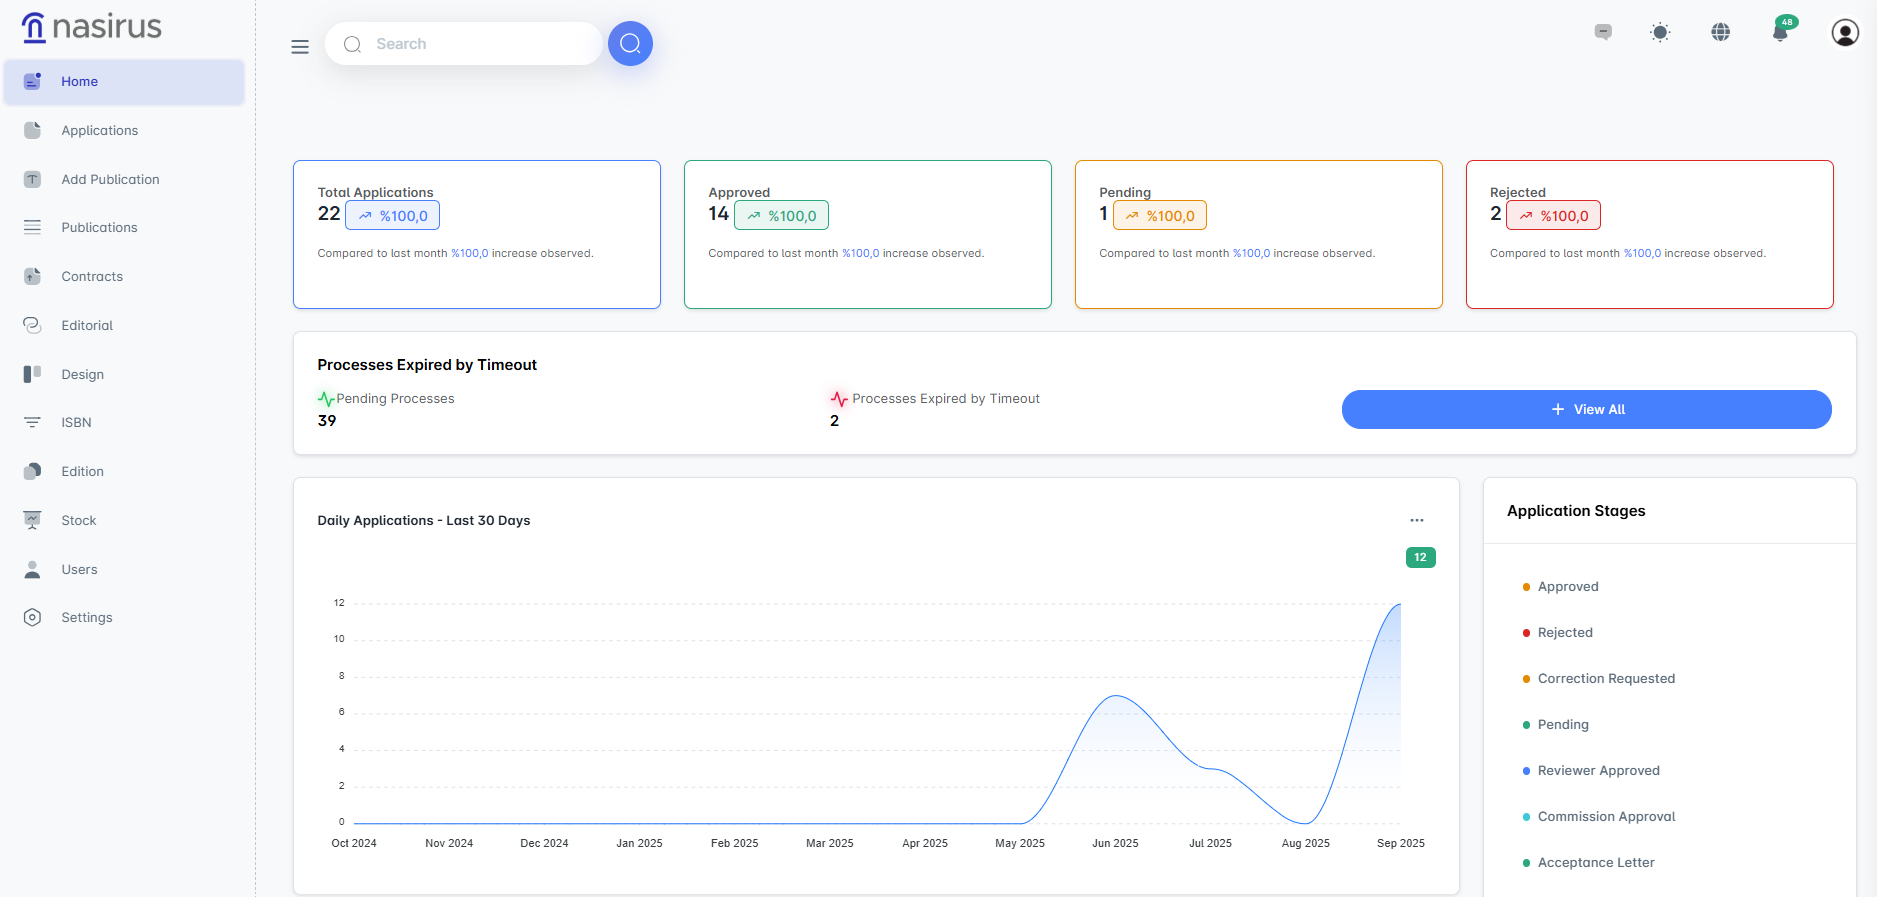
In this section, the total number of applications, as well as those approved, rejected, and pending, are displayed in a summary format. Additionally, you can track application trends over the last 30 days through a graph.
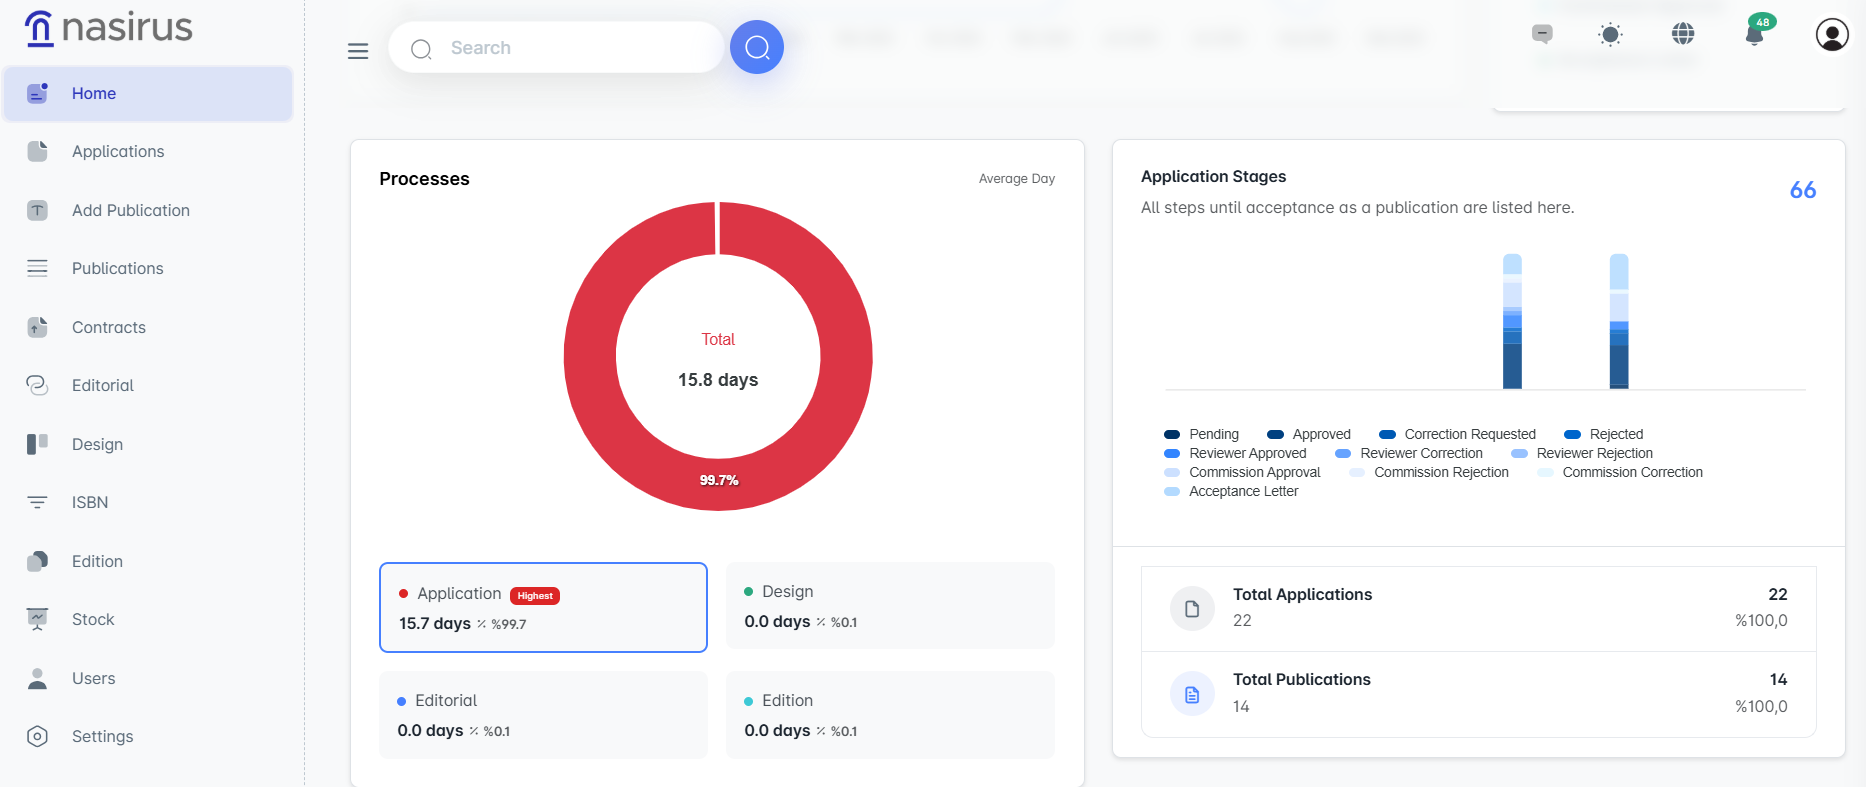
Here, the average time applications spend in each stage is displayed. The application stages are listed in detail, including approval, rejection, correction, and committee processes.
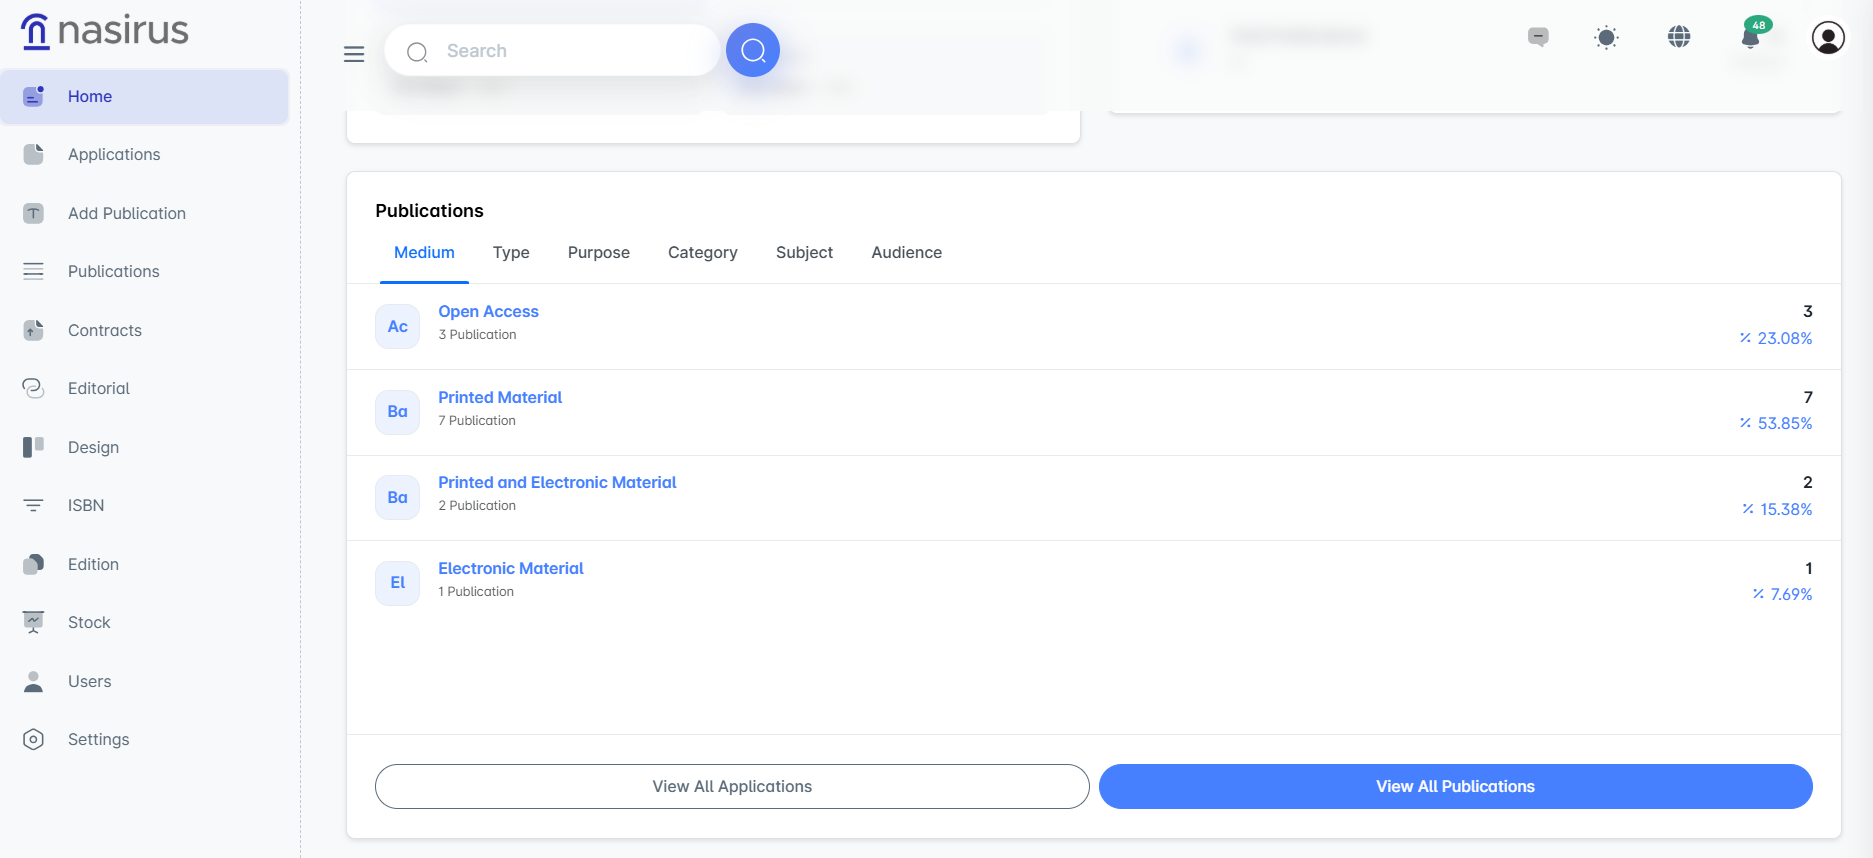
In this section, your publications are displayed classified by medium, type, purpose, and category. You can view the distribution of publications and access a detailed list using the “View All Publications” option. Additionally, you can access the applications list using the “View All Applications” option.